 |
|
R Centauri, an interesting southern variableJ.R. García and S.A.Dominguez 1.Introduction R Centauri (RA = 14 h 12m57s, Dec. = -59º 04.0' (1950)), is a very interesting southern long period, Mira type, red variable star. According to GCVS (Kholopov et al, 1985), it has been classified only as a long period Mira type variable with the following elements:
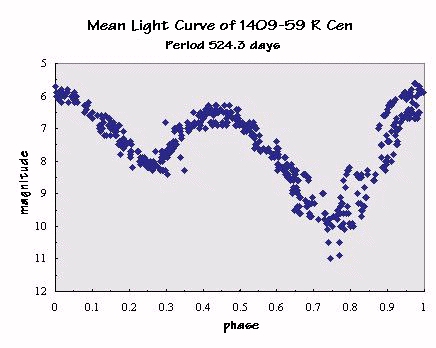
2.Observations This study is based on 527 visual observations performed by Dominguez, which cover the interval JD 2447195 - JD 2450545 (3350 days), that corresponds with the last main six cycles of the star. The measurements were performed using the real step Pogson's method. The instrument used was a 104 mm (4"), f/d = 8.9, Newtonian, with a 23 mm Kellner eyepiece. It has a limiting magnitude about 11. 3.Reduction, Analysis & Discussion Using the observed light curve we proceed with the determination of the power spectrum for the observations. Then, we use a software by Bazterra and García (1992). The discrete Fourier analysis gave two periods: one including the whole maxima of 261.9 days and the other, discriminating the two maxima I and II, of 524.3 days. The mean light curve, using JD 2447407 as an initial epoch of primary maximum and a period of 524.3 days, is plotted in Figure 1.
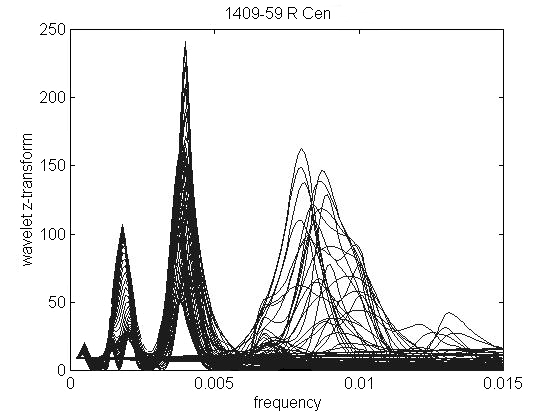
The mean light curve is centered on a primary maximum. Then we determine the times of the primary and secondary maxima, and applying least squares we found the following new elements, in complete agree with Fourier analysis: T{max}= JD 2447406.71 (+/-0.48) + 524.31 (+/-0.16). The standard error for the calculation R was 0.9999996. The shape of the mean light curve, from Figure 1, is (m II-M I)/P=0.26; (M I- m I)/P=0.77; (M II - m II)/P=0.18; (m I - M II)/P=0.33. The mean difference in amplitude between primary and secondary maxima is 1 magnitude, and between primary and secondary minima is 2 magnitudes. Due to the presence of other peaks in the power spectrum, we submitted the observations to the software called Weighted Wavelet Z-transform, as defined by Foster(1996). By means of this software we can see the two dimension diagram, on Figure 2, showing the weighted wavelet Z-transform for the different frequencies involved in the time-series, and their behavior.
The shift of the curves means a change in frequency. For that center at about 0.018 it means an increase in the frequency (shorter period). For that center at the boundaries of 0.004, the frequency decrease, which implies a longer period. The other peak is diffuse and it can explain itself clearly this anomalous behavior. 4.Conclusions As we can observe, the new obtained elements are the best representatives of the star's behavior. Even though these elements have been calculated for the interval February 1988- April 1997, which corresponds to our observation's interval, it is possible to accept them as valid hereafter. Further analysis, with a data series longer along time, will be performed. Acknowledgments One of us (García) would like to thank to the Instituto Superior Santa Trinidad for the financial support for this research and the AAVSO for the financial support travel to the Meeting. We feel in debt with Lic. María José Mundet, for her help with the english language version of this work. References Bazterra, V.; García, J.R., 1992, Contribuciones del Inst.Copérnico I, 11 |
 Institucional
